
September 2025 Market Report
- Oct 17, 2025
- 3 min read

As we wrap up the third quarter of 2025, we continue to track how broader economic forces, particularly tariffs and interest rates, are shaping our local real estate market here in Santa Barbara.

A Market Finding Its Balance
When compared to Q3 2024, this quarter reflects encouraging progress toward a healthier, more balanced market. Inventory, sales, and months of supply all rose year-over-year, signaling renewed activity and stability after several years of tight conditions.
Home prices reached a near-peak of $2 million in Q1 2025, softened slightly in Q2 (to $1.83 million) amid macroeconomic uncertainty, and rebounded in Q3 to just under $1.9 million, nearly level with the same quarter last year.
These patterns suggest a market normalizing after rapid appreciation over the past five years. With interest rates expected to decline and macroeconomic uncertainty beginning to ease, conditions heading into Q4 look promising for both buyers and sellers.
Sales & Inventory
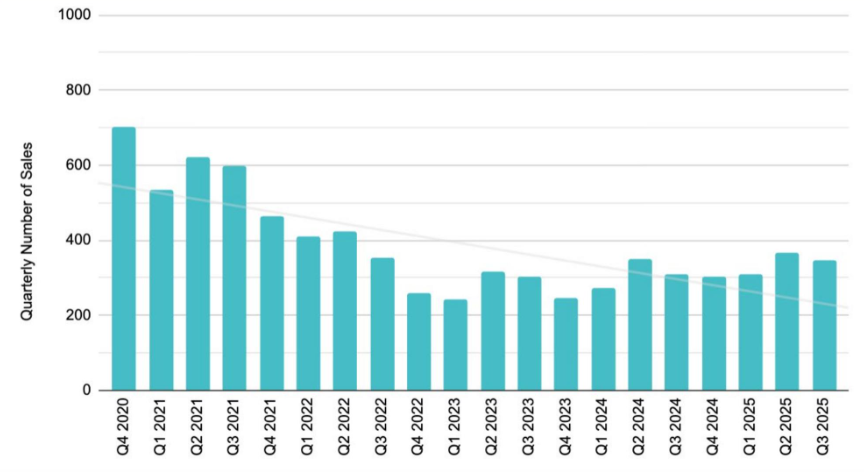
In the third quarter, there were 345 closings across the South County, representing a 5% decrease from Q2 but an 11% increase year-over-year. The quarterly decline is consistent with typical seasonal patterns and even more moderate than usual. Historically, from 2019 to 2024, sales have declined by about 8% from Q2 to Q3 on average—excluding the exceptional year of 2020, when sales surged 103% quarter-over-quarter during the post-COVID boom.
For context, both Q4 2024 and Q1 2025 posted strong, double-digit year-over-year growth in sales (23% and 14%, respectively). By contrast, Q2 2025 slowed to a 4% YoY increase, signaling some normalization after the early-year momentum. While we haven’t yet returned to the accelerated pace of late 2024 and early 2025, the market appears to have stabilized after last year’s tariff-related uncertainty—returning to a healthy, double-digit growth trendline.
Inventory and Months of Supply (MoS) continued moving toward equilibrium during the quarter, ending September at 3.9 months of supply, up from 2.6 MoS at the start of the year. A balanced market is typically defined as four to six months of supply, suggesting we are approaching neutral territory for the first time since before the pandemic. The last time the market was balanced was in 2019, before the COVID-era supply shortages.
Similarly, Days on Market (DoM) data reflects the ongoing normalization. In 2019, the average DoM was 75 days. During the rapid-demand period of 2021–2023, that number dropped dramatically, reaching a low of 24 days in 2022. Year-to-date in 2025, homes are averaging 38 days on market, indicating a more measured but still active pace of sales.
Pricing
While sales rose 11% year-over-year, the median price across South County held steady at $1.9 million compared to Q3 2024, reflecting only modest changes in the mix of sales by submarket. Compared to Q2 2025, however, the median price increased by 4% (up from $1.83 million).
Since Q2 2024, median pricing has fluctuated between $1.8 million and $2 million, a notable jump from five years ago (Q4 2020), when the median price was $1.3 million—a 46% increase, or roughly 9% per year on average.
That said, market performance continues to vary widely by submarket and should always be analyzed in that context.

Looking Ahead
Every neighborhood and property type in Santa Barbara has its own rhythm and story. My role is to help you interpret these trends through a local lens—whether you’re buying, selling, or simply keeping a pulse on your home’s value.
If you’d like insights tailored to your neighborhood or are considering your next move, my team at Spann & Associates is here to help with expert guidance and dedicated service.


Alyson Spann
805.637.2884


